This week, the D Magazine CEO pointed out what the Stars’ and Mavericks’ planned moves would mean for the city. If they both move as planned, Dallas will be a rarity: a major American city with no Big Four team playing in or next to its urban core. The Cowboys and Rangers already play in Arlington. The Mavs are headed to the old Valley View Mall site at LBJ and Preston. The Stars want Willow Bend in Plano.
I grew up in Oak Cliff, and loved the Mavs in the pre–Mark Cuban era when they were terrible. The moves north don’t bother me, but I do wonder why. To me, they feel almost preordained: Dallas has been moving north for a very long time.
Growing up across the river
In the 1990s, crossing the Trinity felt like crossing a border. You didn’t need a map to know when you’d left Oak Cliff and arrived in North Dallas. More restaurants. More shops. More banks. More wealth.
I will say that both Kessler Park and North Oak Cliff are nicer now than when I lived there in the 1980s and ’90s. Bishop Arts is a destination. There’s the streetcar from downtown. But drive from Kessler Park up to Preston Hollow and back, and the gap is still there. And it’s just as stark when you head south from Bishop Arts.
So I went looking for why, and I used my trusty assistant Claude to help with this research. As an aside, I started this research on Friday night, let Claude run overnight and finished up the study and visualizations on Saturday morning. The speed is amazing.
I’m no journalist, just a hobbyist with a theory, curiosity and AI tools at my disposal.
So, using census data back to 1970, a century of newspaper and magazine coverage, and old city planning studies, I’ve come to a conclusion. The story of the NBA and NHL franchise moves isn’t one that started a few years ago. It started long, long ago, when Dallas began neglecting its southern half after World War II.
Oak Cliff wasn’t always the “other side”
It didn’t have to be this way. Oak Cliff started as the fancy address, a place for the wealthy to congregate. In 1887, developers Thomas Marsalis and John Armstrong sold lots there as the “Cambridge of the South,” with a steam railway to downtown, a resort hotel and a 150-acre park. Armstrong went on to build Highland Park. Same developer, two suburbs, very different fates.
Oak Cliff’s early troubles weren’t about race. The Panic of 1893 wrecked its finances. In 1903, Dallas annexed the broke town after a vote decided by fewer than 25 votes, and Oak Cliff’s own officials sued to stop it (and lost). Then the 1908 flood washed out every bridge across the Trinity. For days, the only way to Oak Cliff was by boat.
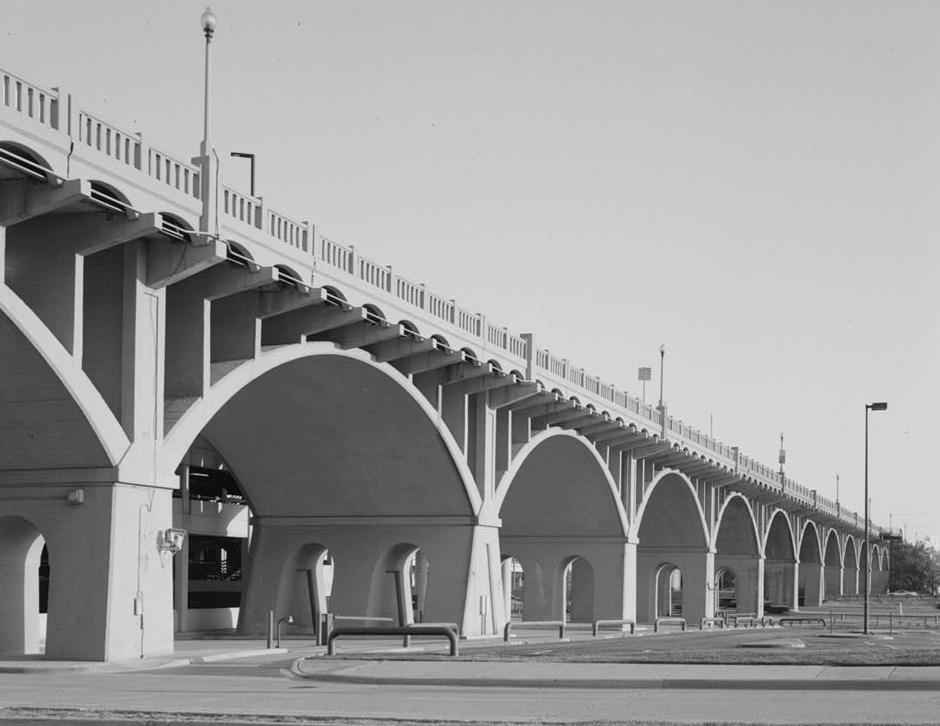

There was investment in the early days. The Houston Street Viaduct opened in 1912. The zoo moved to Oak Cliff the same year and has stayed there for more than a century. Oak Cliff became a thriving streetcar suburb. For about fifty years, the river was a physical barrier, not a social one.
The decisions that made the difference
That changed after World War II. Between the 1950s and the 1980s, Dallas made a string of decisions that, added together, made southern Dallas a harder place to build, borrow and do business.
The freeways came first. Work on the R.L. Thornton Freeway (I-35E) started in December 1955 and cleared about 175 Black-owned homes and businesses in Oak Cliff’s Tenth Street neighborhood, a freedmen’s community that dated to the 1880s. At least 12 bombings in 1950 and 1951 targeted Black families who moved onto white blocks in South Dallas. Federal redlining maps from 1937 had already marked much of South Dallas as hazardous for lending.
Then came the 1970s. School desegregation hit, and white families left. The census tract around Bishop Arts went from 96% white in 1970 to 48% white in 1980. South Oak Cliff High went from all-white in 1966 to 94% Black by 1969–70.
By 1982, D Magazine described Oak Cliff’s image as “poor, black, uneducated and crime-ridden,” noted that Realtors steered buyers away and lenders redlined, and then used the city’s own crime rankings to show the image was worse than the reality.
Race was involved. It wasn’t the only factor. The Trinity floodplain, the bust of the 1890s, the freeway engineers’ maps, the 1980s oil collapse: all of those mattered too. But the decisions compounded. Freeways cut neighborhoods apart. Lenders pulled back. Families left. Stores followed the families. A WFAA count found 474 bank branches north of I-30 and 58 south of it. A Dallas food desert researcher was told by a grocer, “I am not sure we want that kind of customer.”
That’s not a market quirk. That’s fifty years of choices showing up in a store-location spreadsheet.
How we got here, 1887–2026
Filter by thread to follow one part of the story.
The center keeps sliding north
So what does that look like on a map? Every census, you can calculate a region’s center of population: the balance point where everyone’s location averages out. I tracked it for the Dallas side of the Metroplex and for Houston from 1970 to 2020.
In 1970, Dallas’s center sat about 4 miles north of downtown. By 1990 it was 6 miles. By 2020 it was nearly 10 miles north, just shy of LBJ Freeway. It never wandered. It just walked north, decade after decade.
Houston’s center did something completely different. In 1970 it was almost 4 miles southeast of downtown. It crossed right over downtown and settled about 4.6 miles to the west-northwest. Houston grew on several sides at once. Dallas grew in one direction. Geography explains part of that: the Gulf of Mexico limits how far Houston can grow to the southeast. Dallas has no barrier like that to its south.
Where Dallas and Houston live, 1970–2020
Each square is about 6 × 7 miles, colored by census tract population. Both maps use the same scale. Pick a year; switch to growth to see where each decade’s new residents went.
Dallas–Fort Worth
Houston
Data: U.S. Census Bureau tract population centers (2000–2020); IPUMS NHGIS tract counts and boundaries (1970–1990). Dallas’s center uses the seven counties on the Dallas side of the Metroplex so Fort Worth doesn’t pull it west.
Play with the map. Click through the decades and switch to “Growth.” On the Dallas side, the orange keeps landing in Collin and Denton counties. In Houston, it shows up west in Fort Bend, north in Montgomery and south in Brazoria.
The county numbers make it even clearer. In 1950, the counties just north of Dallas (Collin, Denton and Rockwall) had about 1.2 people for every one in the counties just south (Ellis and Kaufman). By 2020, that ratio was 6.2 to 1. Plano went from 2,126 people to 285,494. DeSoto went from 298 to 56,145, which is real growth, but nowhere near the same scale.
North versus south, 1950–2020
In 1950 the counties just north and just south of Dallas were about the same size. Houston’s outer counties grew on several sides at once.
Dallas side
Houston
Twelve towns that were all small in 1950
Data: decennial census counts. Hover for exact figures and 1950 populations.
Zoom in and it gets even more personal. Here’s the ground the center of population actually crossed. Dallas’s red dot walks straight up through the Park Cities, past NorthPark and Preston Hollow toward LBJ. Houston’s swings right across downtown and ends up just a few miles from it.
The center of population, up close
A 15 × 15 mile window around each city’s center of population, in 1-mile squares (lightly smoothed). Step through the decades and watch the red dot.
Dallas
Houston
Data: U.S. Census Bureau and IPUMS NHGIS. Tracts for 1970–1990 are placed at their geographic centers, 2000–2020 at their population-weighted centers.
Downtown gets squeezed
This is where downtown comes in. A downtown works best when it’s near the middle of where people live and where the money is. Houston’s downtown still is, and its light rail runs straight from downtown to the Medical Center and NRG Stadium. Dallas’s isn’t, and it keeps getting farther from the middle.
Downtown Dallas already had one near-death experience. Freeways ringed it in the 1950s through the 1980s. Offices followed workers to Las Colinas and Legacy. Then the oil bust and the banking collapse hit, and by 1996, about 36% of downtown office space was empty and only a few hundred people lived there.
The comeback since then is real but still limited. Tax-increment districts paid to turn empty towers into apartments. The Arts District, Klyde Warren Park and light rail gave people more reasons to live there. Downtown went from about 200 residents to 15,943 at the end of 2025.
But downtown is a neighborhood now, not a jobs center. It holds about 3% of the region’s jobs. Las Colinas alone has more. Office vacancy runs somewhere between 27% and 35%, depending on who’s counting. And 2026 has been brutal. AT&T announced in January it’s moving its headquarters to Plano. Comerica, now owned by Fifth Third, is leaving Comerica Bank Tower for Preston Center. The convention center rebuild slipped to 2030. Then on November 3, Dallas voters rejected a city bond for the first time in 48 years, partly over fears it was a step toward abandoning City Hall.
Why the teams are leaving
Which brings me back to the Mavs and Stars.
It’s easy to call this greed or bad leadership, but think about it from the teams’ side. Season ticket holders and suite buyers are likely to come from the north where the money lives. I’d be shocked if either team didn’t know exactly where its revenue comes from.
The money lives up the Tollway. Plano offered up to $700 million in infrastructure for the Stars. The Mavericks found 104 acres at Valley View, less than 2 miles from the Dallas side’s 2020 center of population. If you were starting from scratch, why wouldn’t you build there?
This is my central point. If Dallas’s center of population were close to downtown, like Houston’s, the Stars wouldn’t want to move to Plano. Houston keeps the Astros, Rockets and Dynamo downtown, and its center sits less than 5 miles away. Dallas’s center has drifted so far north that leaving downtown looks like the rational move.
Here’s one wrinkle worth noting. On November 3, Plano voters rejected the venue tax for the Stars arena. The Stars say they’re still committed. We’ll see. And there’s a tax district that links Valley View to the RedBird redevelopment in southern Dallas, so the south will get a slice of the tax growth from a northern arena. Just not the arena itself.
What this means for downtown
I don’t think downtown Dallas is dying. The residents are real, the parks are real, and the restaurants are reportedly full on Friday nights. But I do think it will keep struggling as long as the region’s center of population keeps sliding away from it and businesses continue to depart.
And the honest fix isn’t another downtown incentive package. It’s the thing Dallas has avoided for seventy years: making the southern half of the city a place where people with money want to live, shop and build. Grocery stores. Hospitals. Bank branches. Jobs. If the south grew the way the north did, the center would drift back toward downtown, and downtown wouldn’t have to fight gravity.
But I think that ship sailed long ago.
Dallas didn’t lose the Mavericks and Stars in 2026. It started losing them in 1955.
Sources and data
Census tract data comes from the U.S. Census Bureau’s population-center files (2000–2020) and IPUMS NHGIS (1970–1990). County and city counts are from the decennial census. Key reporting: D Magazine (“Roots of the North/South Rivalry,” 1982; “Hidden Treasure,” 1982; “In the Name of Progress,” 2021), Downtown Dallas Inc.’s Q4 2025 State of the Market, the FDIC’s History of the Eighties, KERA, FOX 4, The Real Deal and the Dallas Morning News.